Flow edition")
Update: I originally implicated the FANGs here but that was unfair. Netflix sponsors pretty cutting edge ML research and Google has Hal Varian running a world class econometrics shop.
I’ve been having a rough time with ‘data science’ lately so I thought I would try to put some of my beef into words. I’ll use an example that I claim is representative of the type of data anthropology that tech shops seem to be passing off to the public as ‘data science’ these days: Do people with blue eyes make more money? First off, the policy-wonk in me doesn’t really like this because there’s no actionable intel associated with it (if I had blue eyes I’d make more money? Yeah, and if your aunt had a dick she’d be your uncle, big deal.). But Ima look past that and proceed.
So many tech shops in the valley have a big web presence which allows them to harvest data on millions of fields, billions of times a day. With all that data and an army of button pushers (or ‘data scientists’ if you prefer) they can dredge through an almost infinite number of interactions looking for patterns…Hell, there’s even a function in R called ‘dredge’ that will run every conceivable combination of variables in a model and tell you which one has the best fit. BTW: Actual scientists tend to think it’s a bad idea to do such things. (Quick digression: yes, this type of thing happens in actual science too. The science community is not immune to data hacking…but from what I’ve seen, “Data Science” is far bigger offender).
Staying with my “do people with blue eyes make more money?” example: since computing power is cheap, with an army of button-pushers and mountains of data at their disposal they could take a giant block of data (say a billion rows and a million columns) and 1 million X 1 million covariance matrix of first order interactions…or maybe they want a correlation coefficient and a p-value, no problem. One could start interacting the variables with one another and testing those correlations. If done long enough, they’ll probably find at least a few relationships that appear significant (broken clock is right twice a day, blind squirrel finds a nut once in a while, etc.). Suppose an analyst calculates a giant mess of correlation coefficients and associated p-values, the code runs for several hours, analyst comes back to check on it and notices there is 


Now that they found an interesting statistical relationship, they need to come up with a story so it doesn’t sound spurious. That’s not too hard: blue eyes are genetically rare, in an Anglo-European sort of way they may tend to be associated with conventional attractiveness (think of the cliché blonde hair -blue eyed Swedish Airline Hostess) which probably tends to favor one in the job market. There you go! It makes perfect sense, blue eyed people make more money.
Ok, even a button pusher probably knows enough to poke at the first run results a bit. Suppose we’re dealing with a highly evolved button pusher who says, “well this unconditional relationship is cool, but it would be a lot cooler if I conditioned the relationship on some other stuff just to make sure it stands up.” Maybe the data are primarily social or primarily life-style oriented so they can’t include a bunch of stuff that might actually impact someone’s earning but, hey, you play the hand your delt, Amirite? Well, they can condition on other stuff in any number of ways… thinking back to that data mining class they might remember the awesome visual power of the prediction tree (classification tree, decision tree, whatevs). Let’s make one of those! This would sort of control for confounding relationships in the sense that if blue-eyed people all have relatively big feet and it’s really big feet that are driving the earnings power then the variance decomposition algorithm embedded in the decision tree should catch the blue-eye-big-feet interaction.
Just pop the data into any stats software and there’s probably some function that will recursively partition the data looking for a tree structure that minimizes within leaf variation. Don’t forget to apply the industry-approved rules of thumb for stopping criteria (don’t split a node of the result would have fewer than 5 data points, when a split increases the information criteria by less than some convergence criteria, etc.), and VIOLA! He’s done it! The coolest prediction tree ever:
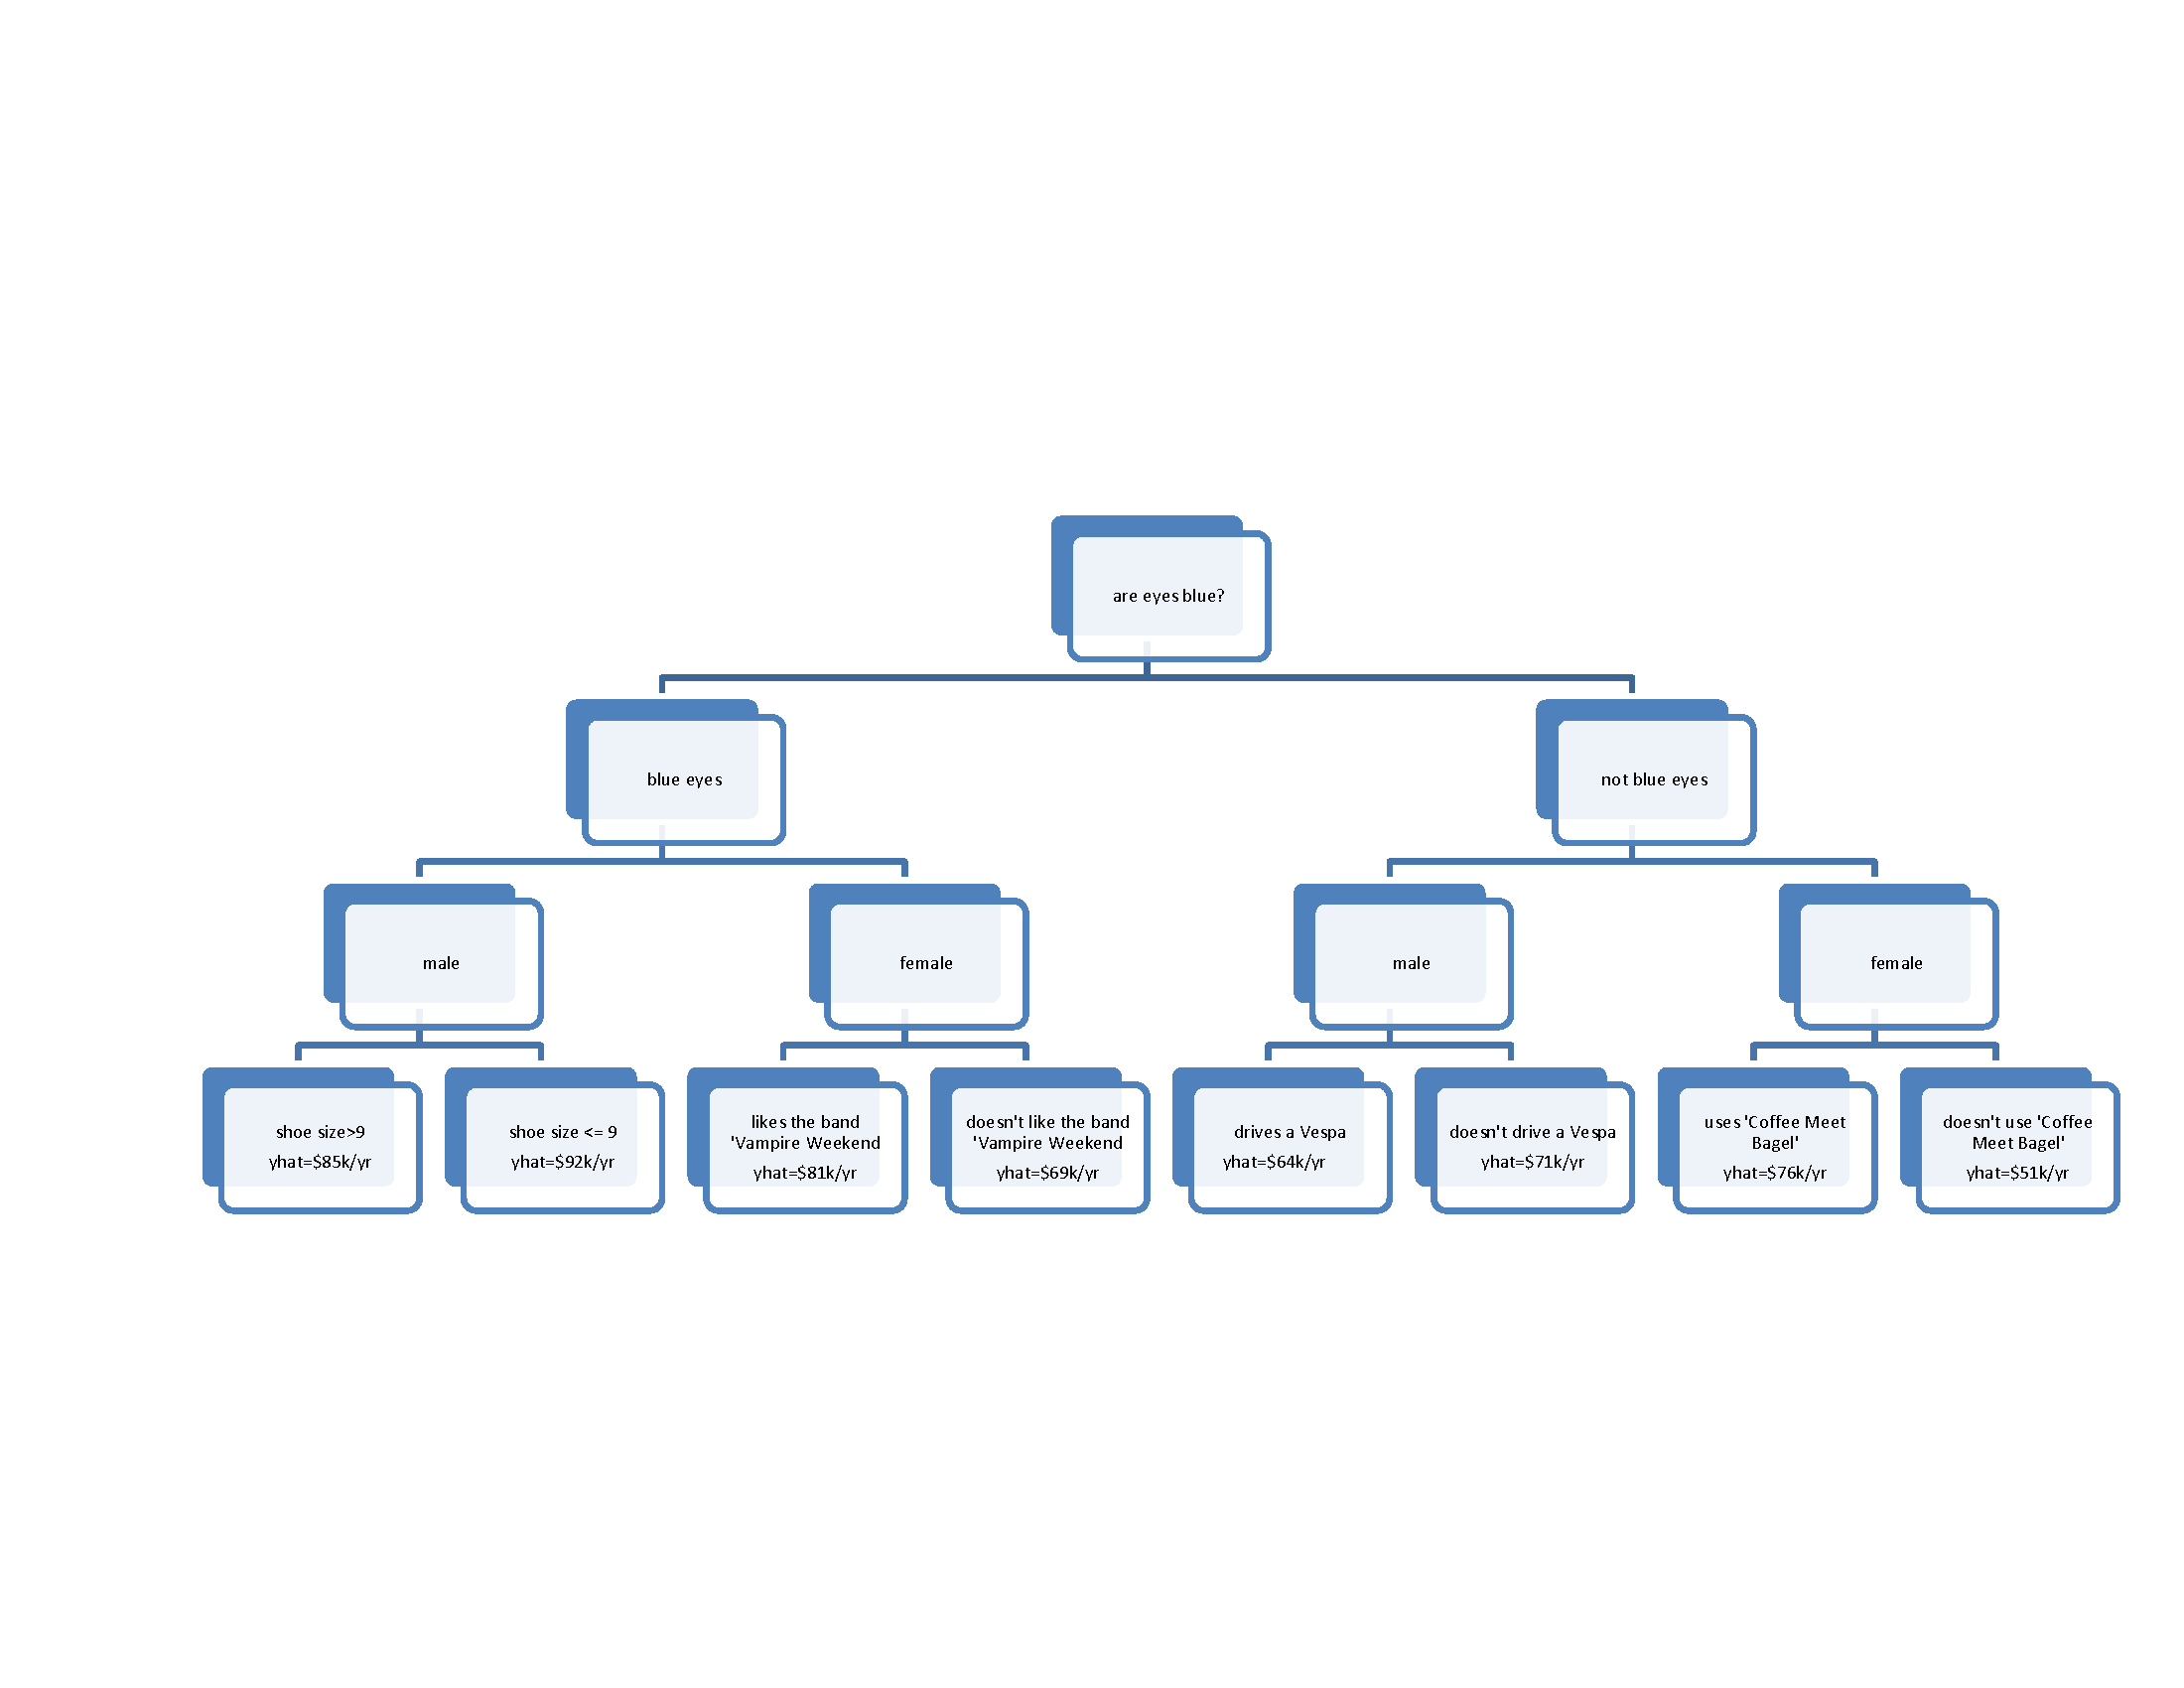
Women without blue eyes who don’t use the ultra-trendy dating service ‘Coffee Meet Bagel’ are hosed (average salary of $51,000/year) and men with blue eyes, small feet, and who incidentally may or may not drive Vespas, are cleaning up (average salary of $92,000/year)!
This a super-fun prediction tree but it’s total crap. It may not be crap in the empirical sense (they did the statistically prudent thing with the data available) but it’s likely crap in the practical sense. The tree may even predict salary ranges reasonably well, but the predictors identified are unlikely to have any real connection with one’s earning power….except for male/female, that shit is well documented at this point.
Here’s where I think Science differs (should differ) from what seems to be passing for ‘Data Science’ these days: Hustle and (mind)Flow
1. Hustle. If we wanted to we could address the question of whether blue-eyed people make more money. On its face I don’t think this is a ridiculous question…a little frivolous maybe but not uninteresting. However, to do it right we need, at a minimum, some data on stuff that might actually impact one’s earning potential: education, field of employment, etc. This stuff is unlikely to be sitting there in a single nice sanitized database table along with all your other data. Tough shit! Science is about the hustle. Every analysis I’ve done has involved me getting Medieval on some data collection. Pull it off the internet, parse it, organize it, email people, interview people, hassle people, get creative, get your ass down to the county Tax Assessor’s Office and get a box of paper copies of land parcels and assessed values. Can’t get data on education? Don’t give up (most economists these days hate the Mincer Equation anyway, maybe you can get birthday/birth month to instrument for education). Hustle.
2. mind(Flow): Scientists occasionally like to stop and think about what they’re doing. If you want to be a Data Scientist rather than a Data monkey or a Data Anthropologist, take a deep breathe and think for a few fucking seconds about what you’re trying to do. Like item #1 above, there are ways to get at the marginal impact of eye color on earnings that don’t require perfect data sets…but they do require thinking about bit about causal structures and such.
If all you want to say is that people with blue eyes tend to earn more, that’s cool. But people with yellow fingers tend to have higher rates of lung cancer. This information seems pretty useless to me. What I would care more about is whether those yellow fingers cause lung cancer (they probably don’t, they’re probably a symptom of smoking which likely causes both yellow fingers and lung cancer). Directed Acyclic Graphical Models can be a neat tool for causal inference. Check out Spirtes, Glymore, and Scheines, Causation, Prediction, and Search, Judea Pearl’s, Causation, or this pretty accessible and free discussion of Causation with Directed Acyclic Graphs by Richard Scheines.
Here’s my final word: if you want to assess the impact on earnings of eye color then I say shine on you crazy diamond. Do it! but please at least try to do it well. There are ways to make such analysis meaningful but they don’t happen in 3 days with a few quick database pulls, some SciPy hacking and a few working lunches at your onsite sushi bar. Science is a long-con. If you’re not even gonna try and do it right, at least change your business card from “Data Scientist” to “Chief Data Wizard”, “Associate Data Ninja” or something equally edgy.
