
I’ve officially caught the reproducible research bug that’s been going around (ok, maybe the epidemic’s been confined to my workplace). I’ve been experimenting with a variety of reproducible research tools/workflows – git/Github, shell script, etc – and here is my latest tester.
This post deals with a really trivial case that I cooked up just to prove to myself it can be done. We’ll run through it quicky-quicky then I’ll comment on why I think it might be useful in more complex situations.
First, a two line R script that creates a data frame and outputs that data frame to a .csv file:
#!/usr/bin/env Rscript
ipa <- data.frame(Maker=c('Port Brewing','Saint Archer','Knee Deep'),Label=c('Big Eye','Mosaic','Breaking Bud'),Rating=c(3,4.5,4))
write.csv(ipa,'/Users/aaronmamula/Documents/Code/pyRtest.csv')
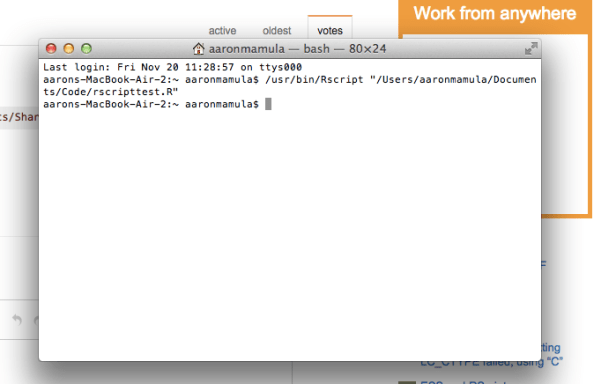
We can run this script from the command line (‘terminal’ if, like me, you’re on a mac) pretty easy:
It is, apparently, just as easy to have python run this R script:
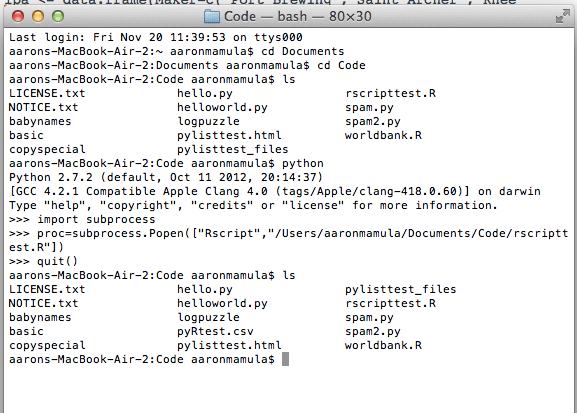
The only thing interesting to note from the screenshot above is that on the first invocation of ‘ls’ in the /Users/aaronmamula/Documents/Code directory is that there no file called ‘pyRtest.csv’ but after we run the R script using
proc=subprocess.Popen([...])
we can see that the second ‘ls’ call tells us that the file ‘pyRtest.csv’ now exists in the directory. Cool, the R script ran and did what it was supposed to do.
Since the exercise above is pretty trivial in nature it’s probably worth commenting on why a Python-Spawns-R-Process might be cool for a data junkie. Here’s a use-case that’s not trivial (I haven’t figured out exactly how to leverage the Python-Spawns-R knowledge to do it yet, but it’s conceptually similar to the example above):
I’m engaged in an ongoing study of unconventional oil and gas exploration in California. The data are pretty complicated:
- I have .csv files (a separate one for every year from 1977 to 2015) on well-by-well production of California oil and gas wells…the separate file for every construct is not my choice, it’s how CA Dept. of Oil, Gas and Geothermal Resources chooses to keep the data.
- I also have .csv files (a separate one for each country in CA) containing water quality tests conducted at several thousand monitoring stations.
- A third set of data are ArcGIS shapefiles containing the boundaries of groundwater basins and Hydrologic Unit Codes for surface water streams in CA.
I have an R script (a really long one) that:
- reads in the various data files (over 50 individual .csv or .shp files)
- relates oil and gas production wells to water quality monitoring wells based on 1km, 5km, and 10km buffers around each monitoring well.
- creates lots of derived variables like the cumulative 6 month lagged sum of production at each oil and gas well
- merges/filters/aggregates/other stuff to create a single simplified data frame that can be used to estimate various models describing the impacts to water quality of unconventional oil and gas production
Here’s the thing: I can (and have) package up all the disparate data files into a .zip folder. Then I can send that folder and my R script to pretty much any R user who wants to use the data to either i) replicate my analysis or ii) estimate their own model for comparison with my analysis. This is fine for all the R users out there but unfortunately some of my colleagues still prefer STATA, MATLAB, or GAUSS for analysis. Although I’ve become increasingly inclined to say ‘tough shit’ to the R-haters, I haven’t given up on them completely. This Python-Spawns-R process is one way that I can give the STATA holdouts access to the exact data set I used in my analysis.
Also, and this is purely speculative, but I figure if I can do this I should be able to use Python to: i) call an R script that runs a model and collects the outputs of that model, ii) passes those outputs as inputs to a FORTRAN model I have, and iii) collects the output from the FORTRAN model and send it back to an R script for processing/plotting/data visualization/table construction for presentation of final output.
True, this solution still requires the user to have R installed on their machine…but it doesn’t require them to know anything about R. They just need to go to the website and point-and-click their way through the installation. True, this solution also requires the user to have Python…but, like R, Python is free and pretty easy to install:
My Mac (OS 10.8) came pre-installed with Python 2.7 and all I have to do to access the interpreter is type ‘python’ at the command line….and they don’t really need to know Python, they just need to know this one line of Python.
A few final notes:
