
This post is going to cover a lot of ground. Here’s the road map:
- The Anaconda Distribution of Python is Awesome
- for data people it ships with lots of libraries we need
- it also ships with lots of apps that make data analysis easy
- Quandl is a Really Sweet Data Warehouse
- it has lots of data
- it also has it’s own Python Module and R Package
- IPython Notebooks are Pretty Much the Cat’s Pajamas
Anaconda Python
I cannot say enough good things about the Anaconda Python Distribution. I know everybody’s workflow is a little different and everybody has slightly different needs when it comes to data. I put myself somewhere at the intersection of data analyst, quantitative social scientist, econometrician, data scientist…Anaconda has most of what I need built in and everything I need can be obtained pretty easily:
- Pandas is a Python module that really simplifies data analysis. I would go as far as to say it’s an ‘industry standard’ data science tool. Pandas ships with Anaconda so there is no need to install it.
- lots of other data analysis/data visualization stuff ships with Anaconda: matplotlib, numpy, pylab, etc.
- Anaconda installs the Spyder IDE which looks a lot like R Studio and also has a look and feel that should be familiar to Matlab programmers…this is big for me. I can generally pick up new languages and tools pretty fast if they look somewhat familiar or I’m comfortable interacting with them.
- Anaconda also makes it really easy to create IPython Notebooks because it installs the Jupyter Application (more on this later).
The Anaconda Dashboard:
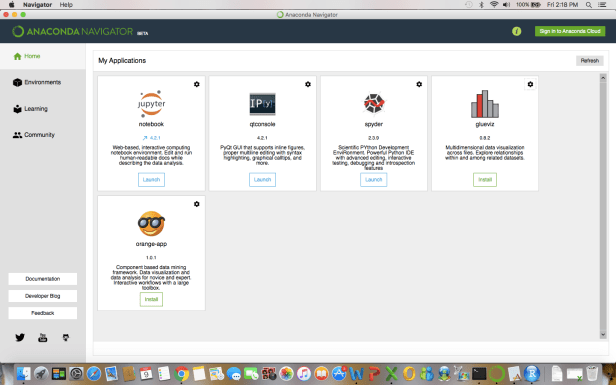
After I launch Spyder from the Dashboard I see this:
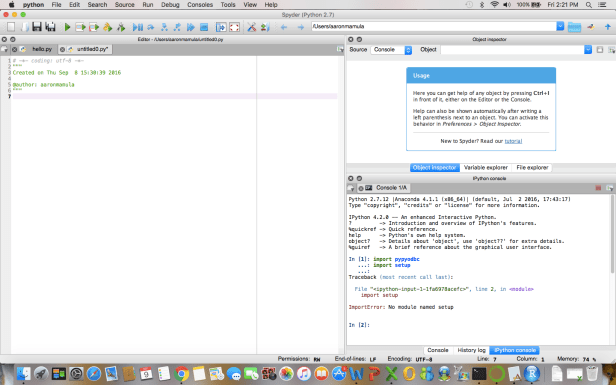
From here you can open your favorite Python programming book or web tutorial and start writing some code. On my Mac I can execute particular lines by highlighting them and doing a fn+f9.
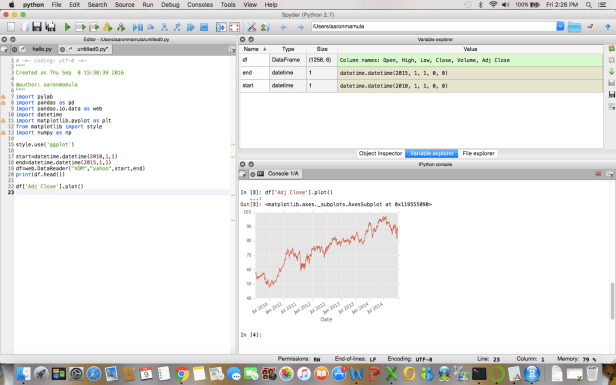
Since I very much hate the standard ‘Hello World’ starting point, here is a screen shot of a few lines of code that pull stock price data for Exxon Mobile from Yahoo finance and plot it. Note that no special installations were required for this run…all the modules that needed to be imported shipped with my Anaconda distribution.
The other feature of Anaconda I really like is how easy it is to work with IPython Notebooks through Jupyter…I’m going to save discussion of that functionality until after we talk about Quandl because I want to demo the Quandle Python Module in an IPython Notebook.
Quandl is a data warehouse and I love it. In the past week I have used it to access:
- Historical home values Santa Cruz, San Benito, Monterey, and San Luis Obispo Counties from 1996 to the present. These data were from a Zillow Database housed on Quandl
- Historical unemployment rates for Washington, Oregon, California, Arizona, Nevada, Utah, Idaho, Montana, Wyoming, Colorado, and New Mexico from 1990 to present. These data come from the Federal Reserve Bank of Cleveland and are available through Quandl
- Infant Mortality Rates for 15 developing countries 1990 – present. These data come from a United Nations databased available on Quandl.
A great Quandl feature is that they have modules for both Python and R. Check them out here, then sign up for an account, get an API key and you can start loading data from Quandl right into your Python or R install.
Quandl + Anaconda Python
In order to work with the Quandl module on my machine I had to install it. With Anaconda that was pretty easy: I opened the Mac terminal and did
conda install quandl
I also installed the Quandl module on my desktop at work which is PC:
pip install quandl
IPython Notebooks
I wrote about R Notebooks here. Everything positive I said about R Notebooks applies to IPython Notebooks…and there are some additional cool features of IPython Notebooks not available with R Notebooks.
For starters, I can start a new IPython Notebook from the Anaconda Dashboard by launching the Jupyter Notebook app. When I do that the following homescreen comes up:
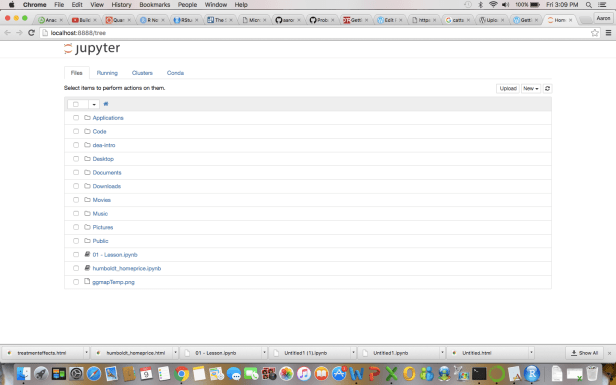
In the top right corner there is a ‘new’ tab. Use that drop down to select ‘Python[Root]’. Now I get my new Notebook:
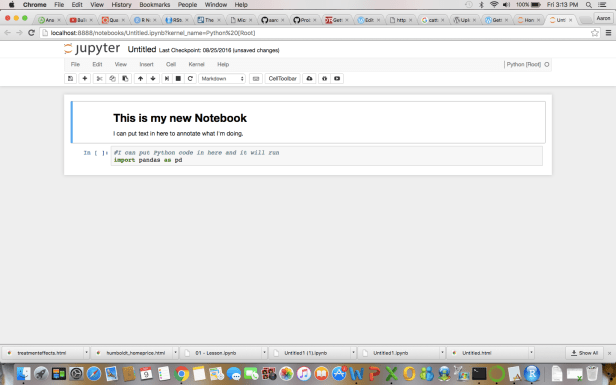
Like R Notebooks, code chunks can be designated as text (Markdown) or code and each chunk can be run independently of other chunks. If you want to run all the chunks you can output to a nice clean .html or .pdf just like with R notebooks.
A Notebook Using Quandl
So I created a IPython Notebook where I did a couple really simple things:
- imported a bunch of libraries (pandas, quandl and some other shit)
- went to Quandl and searched for ‘home prices Humboldt County, CA’ and found a data series I liked (ZILL/CO00399_MSP…median home price in Humboldt County, CA)
- pulled this data series using Quandl.get(), then plotted it.
A super-cool feature of IPython notebooks is that IPython.org will host these Notebooks. You can view my notebook here:
http://nbviewer.jupyter.org/gist/aaronmams/a6960b88d5f1e30c7dff3e882d8960b6
NOTE: Yes, I kept my Quandl API key hardcoded into the Notebook. If you plan on running the code chunks do me a solid and substitute in your own API Key.
And if you want to upload your own Notebook to the nbviewer host at ipython.org check out this dude’s youtube video which walks through how to do it.
Bonus
If I’ve already convinced you to install Python using Anaconda, you can also download the ghetto Notebook I made using the download button in the top right. You can then open the Notebook in your own instance of IPython and run the code chunks yourself.
