Interested parties can now download the code for my little time-series data exploration from GitHub:
- the url is: https://github.com/aaronmams/cool-time-series-stuff.git
- the repository homepage is here if you want the SSH key or anything
I tried to include a .md doc in the repository explaining key features of the code…keep in mind this is a work in progress, meant to help me practice my rusty time-series analysis skills. I’m trying to be clear and transparent about what’s going on…but if something’s not really clear, send me a pull request.
This is probably repetitive but…the backbone of the project is a pretty ugly and simple function I wrote to generate two time-series of data. I added a little flexibility to this function so that the user can mess around with the seasonality and noise in the data. So you (the user) have some authority over the shape of the data but you won’t be able to change it’s basic features:
- the series will contain 10 years of monthly observations (120 total obs)
- both series will have an abrupt change in the nature of the seasonal component following the 6th year.
- the first series will transition from having no seasonality in years 1-6 and a distinct seasonal pattern in years 7-10. You will be able to control how noisy the series is in each of these periods
- the second series will have a seasonal pattern in years 1-6 and years 7-10 but that pattern can be different. You can control how different.
You have the choice of using the function I wrote in order to generate two new time-series of data to play around with…or you can use the dataframe that the previous blog posts used. I include that dataframe as a .RDA object in the GitHub repo.
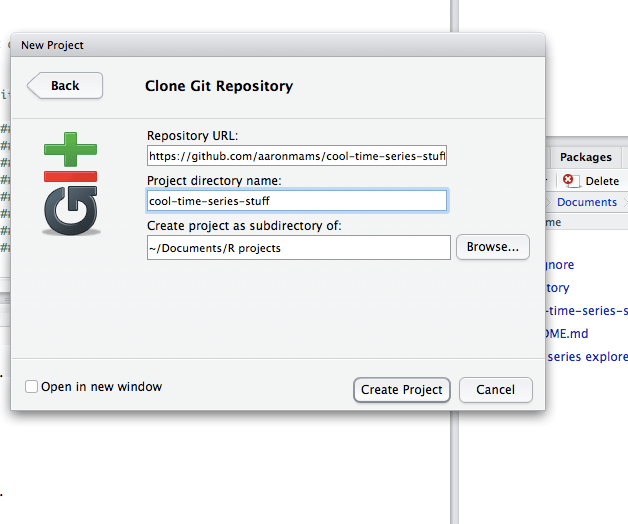
I had a little trouble operationalizing a github cloud repo for this project on my Mac so I’m going to give you the play-by-play for how I did it in another post.
